German vs. Allied war-making potential

Discussions on the economic history of the nations taking part in WW2, from the recovery after the depression until the economy at war.
Post Reply
User avatar
LWD
Member
Posts: 8618
Joined: 21 Sep 2005, 22:46
Location: Michigan

Re: German vs. Allied technology

#196

Post by LWD » 16 Dec 2009, 22:06

Guaporense wrote:
LWD wrote:
Guaporense wrote: ...Germany was economically superior to both Britain and the USSR, maybe Ger was economically superior to both put together ...
This is very suspect. If you look at table 3 in Wages of Destruction It lists the relative GDPs (US=100) as 33 for Britain and 33 for Germany. (This is for 1924-1935) and 35 for the Soviet Union. However Canada is listed at 6 New Zealand 1, and Australia 4 giving the British Commonwealth a combined 44 to Germany's 33. Even if things changed by 39 it's unlikly that Germany surpassed the Commonwealth and certainly not the Commonwealth and the USSR.

Table 17 is also of some interest as it list armaments produciton 1942-1944. The only area listed where Germany exceeds the USSR is in "major naval vessels".
You use GDP and munitions numbers, both are different categories than mine.
No I used GDP and armaments. The fact that they are differen than yours is irrelevant as both the ones I use and the ones you use are measures of varrying worth in measuring total economic stength.

I wrote a longer response but the rest of your post is suspect for a number of reasons including:
1) Failure to include the whole British Comonwealth.
2) Failrue to take into account the artifically high value of the RM post 1932.
3) Cherry picking of dates. (IE looking at USSR GDP in 42)

Other areas where it is suspect are:
1) When and how the GDP of conqured territories should be added.
2) Relying on steel production alone or with only one or two other measures such as Aluminum production as a measure of economic or industiral strength.
4) Your numbers in general and how you interpret them.

User avatar
Qvist
Member
Posts: 7836
Joined: 11 Mar 2002, 17:59
Location: Europe

Re: German vs. Allied technology

#197

Post by Qvist » 16 Dec 2009, 22:41

I dont recall either of them suggesting that at the end of the day the war was won because of any other factor than the Soviets and Western Allies having more manpower and economic muclse to throw around; just that the idea of the British Army bumbling along and using this only factor to win its battles - they suggest and argue that it was a little more complicated than that.
Right, well, that's a different cup of tea altogether. Dupuy's results won't go away that easily though, inconvenient though they be.

cheers


RichTO90
Member
Posts: 4238
Joined: 22 Dec 2003, 19:03

Re: German vs. Allied technology

#198

Post by RichTO90 » 16 Dec 2009, 22:56

LWD wrote:I wrote a longer response but the rest of your post is suspect for a number of reasons including:
1) Failure to include the whole British Comonwealth.
2) Failrue to take into account the artifically high value of the RM post 1932.
3) Cherry picking of dates. (IE looking at USSR GDP in 42)

Other areas where it is suspect are:
1) When and how the GDP of conqured territories should be added.
2) Relying on steel production alone or with only one or two other measures such as Aluminum production as a measure of economic or industiral strength.
4) Your numbers in general and how you interpret them.
Increase in munitions production (normalized to US dollar costs) 1934/35 to 1944:

US…times 140
UK…times 22
Japan…times 15
USSR…times 10
German…times 7

Value of munitions output (normalized to billions of US dollars) 1934/35 to 1944:

US 0.3/42.0
Canada 0.0/1.5
UK .5/11.0
USSR 1.6/16.0
Germany 2.4/17.0
Japan 0.4/6.0

(Harrison, Resource Mobilization for World War II: The U.S.A., U.K., U.S.S.R., and Germany, 1938-1945, 184.)

Workforce Mobilization 1939/40 and 1943 (millions of workers) Group I Industry/Armed Forces/Total

US 1940 8.4/1.0/9.4
US 1943 11111.0/16.4/35.4

UK 1939 15.8/2.8/18.6
UK 1943 23.0/22.3/45.3 a9lthough I am suspicious of those numbers)

USSR 1940 8.0/5.9/14.0
USSR 1943 31.0/23.0/54.0

Germany 1939 14.1/4.2/18.3
Germany 1943 14.2/23.4/37.6

(Harrison, Resource Mobilization for World War II: The U.S.A., U.K. U.S.S.R., and Germany, 1938-1945, 186.)

REAL NATIONAL PRODUCT OF THE U.S.A., U.K., U.S.S.R., AND GERMANY, 1937-45
Year/U.S.A. (GNP, 1939=100)/U.K. (NDP, 1939=100)/U.S.S.R.(NNP, 1938=100)/Germany (GNP, 1939=100)
1937/--/-- /100/--
1938/--/100/101/--
1939/100/ 103/107/100
1940/108/120/117/100
1941/125/ 127/94/102
1942/137/ 128/66/105
1943/149/ 131/77/116
1944/152/ 124/93/--
1945/--/115/92/--

(Harrison, Resource Mobilization for World War II: The U.S.A., U.K., U.S.S.R., and Germany, 1938-1945, 185.)

Relative Share of the Worlds Manufacturing Output 1938

US 31.4%
Germany 12.7%
UK 10.7%
USSR 9.0%
France 4.4%
Italy 2.8%

(Gropman, National Power (PPT), 14 July 2009, slide 14)

Germany did have a high level of per capita industrialization. Normalized to Great Britain in 1900=100 in 1938 it was:

US 167
UK 157
Germany 144
France 73
Italy 61
Japan 51
USSR 38

(Gropman, slide 13)

User avatar
mescal
Member
Posts: 1415
Joined: 30 Mar 2008, 15:46
Location: France, EUR

Re: German vs. Allied technology

#199

Post by mescal » 16 Dec 2009, 23:07

Guaporense wrote: Germany was more than capable of maintaining armies with enough equipment and supplies to fight effectively anything that the allies could throw at them.
Care to explain why the Heer used hundred of thousands of horses when the 1944 divisions on the Western Front had none ?

Guaporense wrote: Germany was economically superior to both Britain and the USSR, maybe Ger was economically superior to both put together
Nonsense.

You're merely giving examples with some carefully chosen items, which by themselves are not relevant to the question of "economic superiority" (whatever it means).
For example, independently from the correctness of the example you gave, please note that Germany had to PRODUCE her own steel when UK could IMPORT it.


Guaporense wrote: And Overy did make the point that Germany had superior economic resources than Britain and the USSR combined.
In which book/article ?

Guaporense wrote: it is clear that the US produced 1.0 million tons of warships in 1944, while they produced several times that in terms of shipping, landing craft and small boats. I think that having Britain producing 20% of the US's warships ships is quite precise.
No.
1) it is not clear. Ships commissionned in 44 ? building at a given date ? building over th whole period ?
2) What is "warship" ? Do you include AO/AP/AK .... or not ?

Let's look at the ships being built on 01/01/44 in US shipyards :
13 CV @ 28,000 tons standard displacement = 360,000
3 CB @ 35,000 tons = 105,000
2 BB @ 45,000+ tons = 90,000
25 CVE @ 10,000 tons = 250,000
20 cruisers @ 10,000+ tons = 200,000+
around 100 destroyers @ 2,000+ tons = 200,000
Total : around 1,200,000+ tons
And you still have to add around 100 DE (at 1,000/1,500 tons each), the minesweepers, minelayers, tenders etc ...
Far more than 1M tons. And without even counting the oilers, transports ... commissionned in the US Navy - which ARE by definition "warships".

And these data - for cruisers and bigger ships - come from a ship by ship list I made. You can have a look at my posts if you want to double-check.
http://forum.axishistory.com/viewtopic. ... 3&t=147340
http://forum.axishistory.com/viewtopic. ... 3&t=149748
http://forum.axishistory.com/viewtopic. ... 3&t=150413
http://forum.axishistory.com/viewtopic. ... 3&start=30
Note that all these data are minimal values, are the ships commissionned too late to have an active role in the war are not shown.
The destroyer figure is a relatively (I hope) precise guesstimate derived from a similar study which is not over yet.

Regarding the claim that Britain shipbuilding capability was 1/5th of US - would you please elaborate.
I have at least 13 slips capable of accomodating a BB or a CV in the UK vs. at least 20 in the US.
(These are minimal values for each country and not the 'true' values. )


And thank you Rich for the info regarding Trevor Dupuy's work.
Olivier

User avatar
phylo_roadking
Member
Posts: 17488
Joined: 01 May 2006, 00:31
Location: Belfast

Re: German vs. Allied technology

#200

Post by phylo_roadking » 16 Dec 2009, 23:10

Germany was more than capable of maintaining armies with enough equipment and supplies to fight effectively anything that the allies could throw at them.
Care to explain why the Heer used hundred of thousands of horses when the 1944 divisions on the Western Front had none ?
...and by 1945 were using the occasional team of oxen to drag fuel-less tanks in the East? 8O :lol:

User avatar
The_Enigma
Member
Posts: 2270
Joined: 14 Oct 2007, 15:59
Location: Cheshire, England

Re: German vs. Allied technology

#201

Post by The_Enigma » 17 Dec 2009, 00:01

Guaporense wrote:Image

Sources:
John Ellis, World War II : a statistical survey
B. Mueller-Hillebrand, Das Heer 1933-1945 (E.S. Mittler und Sohn, Darmstadt/Frankfurt, 1954-1959), vol. 3, pp. 284-315.
Feldgrau.com
United States Army in World War II, European Theater of Operations,The Supreme Command
I just realised we havent had a comparative pie chart since Rich brought up his figures and sources. I applogise to everyone, i use Office 2003 on a daily basis but have Office 2007? at home and cant use the damn thing proper otherwise this would look all fancy and smart-ass-ish!

German casualties 1 September 1939 - 20 April 1945
Image
Source 1: Feldheer Casualties 1 Sep 39-20 Apr 45 (Organizationabteilung d. Gen.Stb. d. Heer, 26 Apr 45, NARA T78, R414, F3189)

German casualties 22 June 1941 - 31 March 1945
Image
Source 2: Feldheer Casualties 22 Jun 41-31 Mar 45 (OKW KTB, Band IV.2, p. 1515-1516)
(sorry i cropped the side off that one!)

Note: Ostheer and 20th Mountain Army have been lumped together. OB West and the Italy stats have likewise been lumped together and the Balkan ones left alone; do we know if these stats are from fighting the Soviets, the partisans, or the Yougoslav and Greek armies?

Of course the Soviets are still the ones who inflicted the major casualties, i dont believe no one was expecting to see different however they do show an increase in the losses suffered to the western allies (nearly double when looking at the entire war, or a modest 3.5% increase when looking at only beyond Barbarossa; ~430,000 appears to be the difference (the losses suffered during the 1940 campaign?). Would the Ostheer losses for the entire war also include those lost agaisnt Poland during 1939?

User avatar
The_Enigma
Member
Posts: 2270
Joined: 14 Oct 2007, 15:59
Location: Cheshire, England

Re: German vs. Allied technology

#202

Post by The_Enigma » 17 Dec 2009, 00:07

phylo_roadking wrote:
Germany was more than capable of maintaining armies with enough equipment and supplies to fight effectively anything that the allies could throw at them.
Care to explain why the Heer used hundred of thousands of horses when the 1944 divisions on the Western Front had none ?
...and by 1945 were using the occasional team of oxen to drag fuel-less tanks in the East? 8O :lol:
Eco-friendly solutions to cut down on carbon-emissions? Tens of thousands of tanks running about does leave one hell of a carbon footprint - hats off to the Germans for trying to do something about it! A better tomorrow, today! - i would imagine was their solgan for allot of things :P

User avatar
phylo_roadking
Member
Posts: 17488
Joined: 01 May 2006, 00:31
Location: Belfast

Re: German vs. Allied technology

#203

Post by phylo_roadking » 17 Dec 2009, 00:12

...and of course it's a great way of reducing wear on those very late-model steel tyred Panthers... :lol:

And also - like all those Wehrmacht horses in Russia in the winter of '41/'42 - it saves on having to butcher/refridgerate the steaks far behind the front line...

User avatar
Qvist
Member
Posts: 7836
Joined: 11 Mar 2002, 17:59
Location: Europe

Re: German vs. Allied technology

#204

Post by Qvist » 17 Dec 2009, 00:34

Would the Ostheer losses for the entire war also include those lost agaisnt Poland during 1939?
No.

cheers

User avatar
The_Enigma
Member
Posts: 2270
Joined: 14 Oct 2007, 15:59
Location: Cheshire, England

Re: German vs. Allied technology

#205

Post by The_Enigma » 17 Dec 2009, 00:43

Cheers for that; does that mean they are missing from the first source that was provided?

RichTO90
Member
Posts: 4238
Joined: 22 Dec 2003, 19:03

Re: German vs. Allied technology

#206

Post by RichTO90 » 17 Dec 2009, 00:53

The_Enigma wrote:Cheers for that; does that mean they are missing from the first source that was provided?
I might as well post my entire write-up on the subject again. Unfortunately the table formatting will drop out, and I'm not going to reformat them all, so I hope you'll get the sense of them... :D

Welcome to the Nightmare that is German Armed Forces Casualties in World War II

The following are a selection of German casualty estimates for World War II as derived from our study “German and Soviet Replacement Systems in World War II” (HERO Report No. 48, July 1975) and other documents. Please note a very important distinction:

Wehrmacht (Armed Forces) refers to all German armed forces, including the Feldheer (Field Army), Ersatzheer (Replacement Army), Luftwaffe (Air Force), Kriegsmarine (Navy), Waffen SS, Freiwilliger Verbaende (Foreign Units), and Wehrmachtgefolge (non-combatants, including Organization Todt and other paramilitary organizations). And, typically, Heer and Feldheer casualty reports included losses of the Waffen SS and Luftwaffe ground troops (Flak, LW Feld-Divisionen and Fallschirmjaeger). Finally, in some cases it appears that Heer reports included losses in the Ersatzheer as well.

Table I. Heer Casualties 9 Sep 39 - 31 August 1944, Taetigskeitbericht, Chef d. Heerespersonellamt, c. August 1944, NARA T78, R39, F1497)
Losses in the Army and Waffen SS
KIA WIA MIA Total
Army Officers 60,302 101,853 21,001 183,156
Waffen SS Officers (to 31 Jul) 2,685 253 2,938
Army NCO & Enlisted 1,460,388 3,497,391 826,451 5,784,230
Waffen SS NCO & Enlisted 60,991 19,847 80,838
Total 1,584,366 3,599,244 867,192 6,050,802

This report was undated, but appears to have been completed soon after the post-20 July change of command in the Ersatzheer, and was at least in part an effort to clarify the manpower situation. It is unclear whether or not this count includes both Feldheer and Ersatzheer losses.

Table II. Heer Casualties 9 Sep 39 – 31 Jan 1945 (KTB d. OKW, Band IV, 1509-1511)
Losses in the Heer and Waffen SS
KIA WIA MIA Total
Ostheer 1,105,987 3,498,059 1,018,365 5,622,411
Geb.AOK 20 16,639 60,451 5,157 82,247
OB Süd-West 50,481 163,602 194,250 408,333
OB Süd-Ost 19,235 55,069 14,805 89,109
OB West 107,042 399,856 409,715 916,613
Ersatzheer 10,467 42,174 1,337 53,978
DOW 295,659 295,569
Heer Total 1,605,510 4,219,211 1,643,629 7,468,350
Other Total 17,051 2,687 19,738
Total 1,622,561 4,188,037 1,646,316 7,546,914

There are a number of interesting questions and discrepancies in this report. For example, it does not indicate whether or not the DOW figure was deducted from the WIA totals. There is also at least one typo in the original for the number of wounded, since there is a discrepancy of 31,174 between the “Heer total WIA” (as summed) and the “Total WIA” as given in the original. That may be a simple error in the original table, and it is possible that was the figure intended for the missing WIA column under “Other.” Alternately, it is possible the discrepancy accounts for losses in the Polish, Norwegian, French, and Balkan Campaigns (see below). The original also noted that the Waffen SS was included in the “Total.” Note that Geb.AOK 20 also included AOK Norwegen.

Table III. Heer Losses in the Polish, Norwegian, French, and Balkan Campaigns (Organizationsabteilung d. Gen,Stb. d. OKH. 6 Feb 45, NARA T78, R414, F3226-3227)
Losses in the Feldheer
KIA WIA MIA Total
Poland 8,082 27,278 5,029 40,389
Norway 1,166 1,548 1,091 3,805
France 27,650 115,299 13,607 156,556
Balkans 1,593 4,845 644 7,082
Total 38,491 148,970 20,371 207,832

This report apparently refers only to losses within the Feldheer, although it may include Waffen-SS losses as well. It appears that it does not include losses in Luftwaffe ground or airborne formations. For instance the losses quoted for the Balkans must certainly exclude 7. Flieger Division losses on Crete, which were probably 1,032 KIA, 1,632 WIA and 1,759 MIA.

Table IV. Feldheer Casualties 22 Jun 41-10 Jan 45 (Heeresartz i. OKH, Gen.Stb. d. Heer/Gen.Qu., NARA T78, R414, F3228-3229)
Losses in the Heer, Waffen SS, and Luftwaffe Ground Troops
KIA WIA MIA Total
Ostheer 888,262 3,458,986 1,107,339 5,454,587
Geb.AOK 20 16,299 60,329 6,845 83,473
AOK Norwegen 21 94 1 116
OB Süd-West 44,433 160,106 204,854 409,393
OB Süd-Ost 16,113 48,585 16,784 81,482
OB West 60,526 199,107 393,188 652,821
Total 1,025,654 3,927,207 1,729,011 6,681,872

These figures likely include Waffen-SS and Luftwaffe ground forces. Adding the figures from Poland, Norway, France, and the Balkans yields a grand total for 1 Sep 39-10 Jan 45 of: 1,064,145 KIA, 4,076,177 WIA, and 1,749,382 MIA.

Table V. Feldheer Casualties 1 Jun 44-10 Jan 45 (Heeresartz i. OKH, Gen.Stb. d. Heer/Gen.Qu., NARA T78, R414, F3228-3229)
Losses in the Heer, Waffen SS, and Luftwaffe Ground Troops
KIA WIA MIA Total
Ostheer 136,493 632,028 565,834 1,334,335
Geb.AOK 20 4,184 15,034 4,587 23,805
AOK Norwegen 27 71 16 114
OB Süd-West 19,066 66,066 59,889 145,021
OB Süd-Ost 8,241 27,259 11,095 46,595
OB West 59,145 196,134 392,994 648,273
Total 227,156 986,592 1,034,415 2,248,163

This is a subset of Table IV and is the “corrected report for 1 Jun 44- 10 Jan 45 (Berichtigte Meldung fuer die Ziet vom 1.6.1944 bis 10.1.1945).

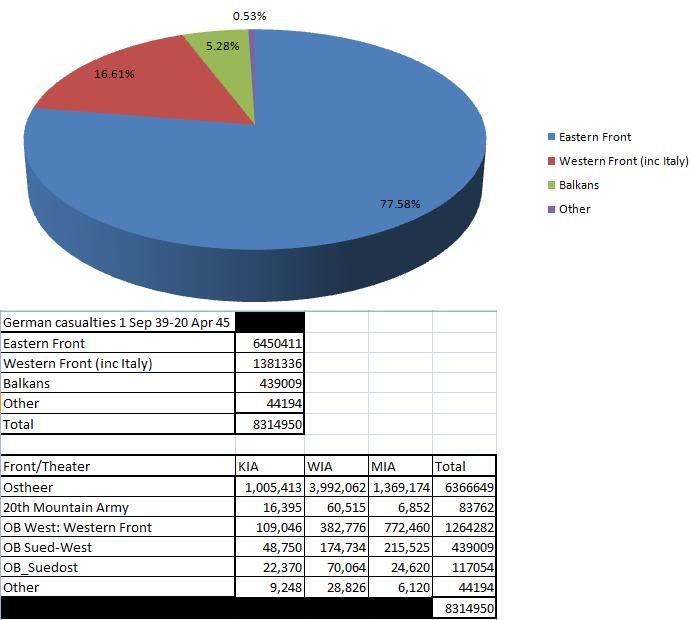
Table V. Feldheer Casualties 1 Sep 39-20 Apr 45 (Organizationabteilung d. Gen.Stb. d. Heer, 26 Apr 45, NARA T78, R414, F3189)
Losses in the Heer, Waffen SS, and Luftwaffe Ground Troops
KIA WIA MIA Total
Ostheer 1,005,413 3,992,062 1,369,174 6,366,649
Geb.AOK 20 16,395 60,515 6,852 83,762
OB Süd-West 48,750 174,734 215,525 439,009
OB Süd-Ost 22,370 70,064 24,620 117,054
OB West 109,046 382,776 772,460 1,264,282
Other 9,248 28,826 6,120 44,194
Total 1,211,222 4,708,977 2,394,751 8,314,950

This table appears to be an amended and updated version of that published in the OKW diary (Table II, above). Note that this table does not include a total DOW, which appears in large part to be responsible for the discrepancy between the two. However, that does not explain the discrepancies in the KIA by theater, especially for the Ostheer. Unfortunately, the original documentary source for the table in the war diary remains to be found, and it appears possible that the cause of the discrepancies may also be simple typographical errors in that source.

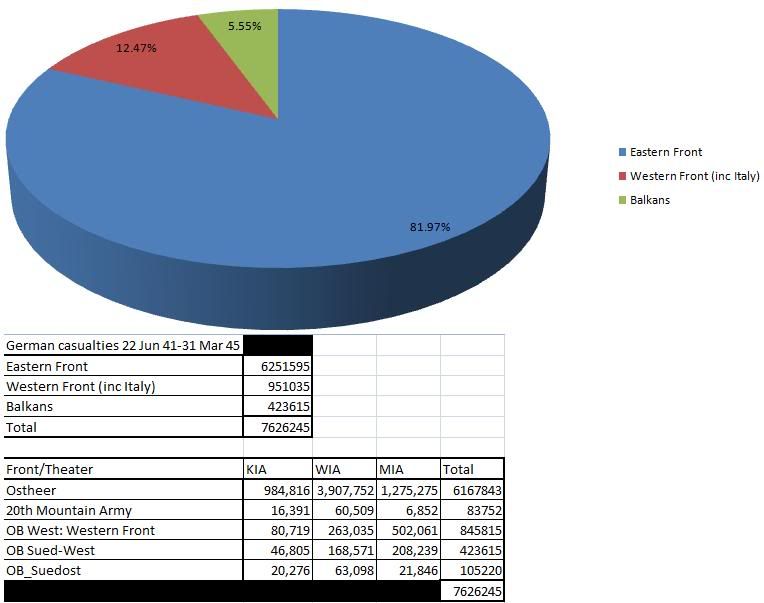
Table VI. Feldheer Casualties 22 Jun 41-31 Mar 45 (OKW KTB, Band IV.2, p. 1515-1516)
Losses in the Heer, Waffen SS, and Luftwaffe Ground Troops
KIA WIA MIA Total
Ostheer 984,816 3,907,752 1,275,275 6,167,843
Geb.AOK 20 16,391 60,509 6,852 83,752
OB Süd-West 46,805 168,571 208,239 423,615
OB Süd-Ost 20,276 63,098 21,846 105,220
OB West 80,719 263,035 502,061 845,812
Total 1,149,007 4,462,965 2,104,273 7,716,245

Unlike the previous KTB entry this one did not include a column for “Other.” Note also that this table covers a different time frame than did the other, although this does not adequately explain the difference between the figures for OB West. There are also a number of typographical errors that may be found when comparing this with a similar table for losses 22 Jun 41-20 Mar 45 in NARA T78, R577, F0810-0811.

Table VII. Total Losses of the Wehrmacht (Gesamtausfaelle der Wehrmacht) by Year (1 Sep-31 Aug) as of 30 November 1944 (NARA T78, R414, F3184)
KIA DEAD UNK EXE MIA PW DIS DES
1939/1940
Heer 64,202 12,159 0 485 1,550 488 16,644 4
Marine 3,021 400 0 4 3 1,393 151 0
Luftwaffe 6,480 1,573 1 26 1,196 793 1,549 0
1940/1941
Heer 122,585 17,399 2 392 7,547 1,222 38,894 3
Marine 4,218 1,249 0 13 37 1,062 360 0
Luftwaffe 11,631 2,642 0 40 2,503 1,857 3,948 1
1941/1942
Heer 422,311 31,921 9 1,394 47,047 11,002 58,818 22
Marine 5,257 2,042 0 119 144 1,172 2,968 7
Luftwaffe 17,842 4,269 2 135 5,445 1,034 14,291 0
1942/1943
Heer 374,084 56,571 73 2,282 287,357 43,547 98,987 230
Marine 12,412 2,562 0 228 2,983 2,087 2,491 49
Luftwaffe 31,117 4,903 19 274 50,005 3,988 11,025 13
1943/1944
Heer 459,476 39,700 139 3,219 764,411 160,677 139,503 329
Marine 14,368 3,303 0 326 16,577 3,268 3,403 45
Luftwaffe 47,706 4,482 25 494 12,739 16,577 15,226 18
1944/1945
Heer 111,406 9,891 0 38 190,817 25,164 26,262 5
Marine 1,740 474 0 38 3,393 9 1,011 6
Luftwaffe 15,758 362 0 6 42,019 2,864 2,821 0
Total
Heer 1,554,066 298,369 223 7,810 1,298,729 242,100 379,108 593
Marine 38,016 10,030 0 728 23,217 8,988 10,384 107
Luftwaffe 130,534 18,231 47 975 113,907 27,113 48,860 32
Total 1,722,616 326,630 270 9,513 1,435,853 278,201 438,352 732

KEY:
KIA = killed through enemy action
Dead = dead through accident, sickness and suicide
UNK = dead to unknown causes
EXE = executed
MIA = missing in action and interned
PW = prisoner of war
DIS = discharged from the service
DES = deserter (still at large)

“Heer” probably includes Waffen SS and probably includes both Feld and Ersatzheer. Note that the approximately 1.5 million each of KIA and MIA & PW for the Heer is considerably higher than in any of the other reports. It appears likely that this may be the most comprehensive and accurate report of the collection.

Table VIII. Heer Losses 1 Sep 39-1 May 45 (Organizationsabteilung d. OKH, 10 May 1945, NARA T78, R398, F8326)
Reported for 1 Sep 39-31 Dec 44 (rounded to nearest thousand)
KIA 1,600,000
Dead 149,000
Other 8,000
Total 1,757,000
MIA 1,334,000
PW 276,000
Estimated for 1 Jan-1 May 45
Dead 250,000
MIA 1,000,000
Total 6,374,000

Losses include Waffen SS and Luftwaffe Ground Forces. The figures for 1 Sep 39-31 Dec 44 appear to be from the same source as the Table VII, although the number of “Dead” in this case is less than one-half that in the previous table.

Finally, “according to a Soviet study [in Voyenno Istoricheskiy Zhurnal, 1960] which cites a German document which has not been located, in June 1945 General Jodl reported that during World War II German losses amounted to 12,400,000 men. Of these 2,500,000 were killed, 3,400,000 were missing in action or known prisoners of war, and 6,500,000 were wounded, 10-15% of them too badly to return to duty. The Soviets rightly question the last figure, and point out that in 1953 there were about 2,000,000 disabled veterans in Western Germany alone, of whom three quarters had more than 25% disability. They cite statistics taken from various German documents that show a total of 8,899,000 casualties (KIA, WIA, MIA, POW) between 22 June 1941 and 28 February 1945, of whom 2,584,000 returned to service, and 6,315,000 were permanently removed from the Field Army” (HERO, p. 49).

The actual total reported for the Feldheer on 28 February 1945 was 1,098,041 KIA, 4,24,694 WIA and 1,860,816 MIA for a total of 7,201,551 (Heeresartz i. OKH, Gen.Stb. d. Heer/Gen.Qu., NARA T78, R414, F3217). Given that Marine and Luftwaffe KIA, MIA and PW totaled 341,775 as of 30 November 1944 (see Table VII), and assuming a 1-to-4 ratio of killed to wounded, then the approximately 1.7-million discrepancy may be accounted for. To that may be added a probable 60,000 plus casualties for the Ersatzheer.

So, what may we all conclude from this? For one thing, it is important to understand that casualties, killed in action, died, died of wounds, missing in action, prisoner of war, and all the other terminology of loss refer to specific things. In terms of the Wehrmacht in World War II, it appears that there is good reason to believe that at least 16 percent of the total identified wartime dead (not including MIA later declared dead or PW who later died) were not as a result of enemy action. Another thing to remember is that all casualty reports refer to a specific population. Thus, Wehrmacht, Heer, Feldheer, Ersatheer, Kriegsmarine, and Luftwaffe all refer to different groups, some of which are subsets of others. And, although we can probably say that Heer losses accounted for about 90 percent of the total Wehrmacht losses, we cannot say that the remaining 10 percent was irrelevant when that 10 percent could include close to 1 million casualties.

Now, how does all this apply to Overmans? Simply put, Overmans’ argument, in its fundamentals, is that previous estimates of German losses undercounted military deaths in the war by as much as 2.2-million. He arrives at that figure by a statistical analysis of a sample of the Allgemeine Kartei, which totals 15.2-million and which in theory represents those Wehrmacht personnel who did not die in combat (that number is documented in the approximately 3.1-million Totenkartei). Now, given that the evidence is that possibly 496,000 of those acknowledged “war” casualties were not combat related (the 16 percent figure above), is it surprising that 14.4 percent of the Allgemeine Kartei sample investigated by Overmans contained cases he classified as additional deaths? One could as easily say that Overmans’ sample was too small (7,619 of 15.2-million or 0.05 percent of the total) and that it is just as likely that 16 percent of the personnel represented in the Allgemeine Kartei, or 2.432-million is the correct number of “additional” deaths.

The crux of the matter is that Overmans assumes that the majority of these “additional” deaths were due to combat. Unfortunately, there does not appear to be much evidence for this theory. Furthermore, his conclusion that the German casualty reporting system prior to 1945 was highly inaccurate has been dealt with in Zetterling’s critique. Zetterling demonstrates that Overmans data, as found in his table of confidence intervals, closely matches the data provided for the Heersartz (on the Ostfront through 4 September the Heeresartz reported about 1,220,000 killed and wounded whereas Overmans calculates 1,240,000 for the same period).

Fundamentally, Overmans problem is that military casualty reporting systems are not really designed to answer the question he raised – “how many German servicemen lost their lives”? Rather, such systems are designed as manpower management tools and as means for tracking the combat effectiveness of a force.

As far as the accuracy of the reporting systems goes, we have evidence from the Germans themselves. On 1 October 1941 a statistical study group had been set up within the Office of Armed Forces Losses (Abteilung Wehrmachtverlustwesen) to resolve problems with the “Central Statistics of Manpower Losses in the War” (Zentralstatistik der Menschenverluste im Kriege). On 30 August 1944 the group issued a report on the “Development and State of the Work” (Entwicklung und Stand der Arbeit) (T77, R780, F2114~). The report gave the following examples of problems in the reporting of deaths (Toten) through enemy action within the existing systems of the Heer:

Polish Campaign: the Sanitats Inspektur (Medical Inspectors) reported 10,244 dead through enemy action, while the KTB of the various regiments reported a total of 14,188. The work of a committee to resolve the status of missing had to the date of the report determined the dead to be 15,450.

French Campaign: the monthly summary by the Wehrmacht Fuhrungsstab (Armed Forces Command Staff) reported 26,455 dead, the Sanitats Inspektur reported 30,267 dead and the MIA committee reported 46,059 dead.

Norway Campaign: the Sanitats Inspektur reported 274 dead, the IVb (Medical Officer) of Gruppe XXI reported 886 dead and the MIA committee reported 1,249 dead.

Eastern Campaign: these two sets of figures for Gefallen (KIA, note the distinction in this example from the others, which refer to Toten) were compiled respectively by the Heersartz to the Wehrmacht Fuhrungsstab and by the Wehrersatzdienstellen (the Armed Forces Replacement Office).

1941 Summer Campaign: 158,773/188,982
41/42 Winter Campaign: 86,287/133,446
1942 Summer Campaign: 131,230/179,456
42/43 Winter Campaign: 93,067/117,339
1943 Summer Campaign: 165,457/193,508

With the exception of the Norwegian Campaign these figures are very different from those laid out in Table III above. But the discrepancies again mostly appear to revolve around the resolution of the fate of the missing, a process that took months and years.

User avatar
Guaporense
Banned
Posts: 1866
Joined: 07 Oct 2009, 03:35
Location: USA

Re: German vs. Allied technology

#207

Post by Guaporense » 17 Dec 2009, 01:34

phylo_roadking wrote:So THIS figure...
Germany was economically superior to both Britain and the USSR, maybe Ger was economically superior to both put together (in 1943, Britain produced 13 MT of steel, 50 KT of aluminium and 200 MT of coal, while the USSR produced 8.5 MT of steel, 50 KT of aluminium and 130 MT of coal equivalent energy (coal + oil), Ger produced 31 MT of steel,50 KT of aluminium and 560 MT of coal, so Ger produced 50% more steel, 125% more aluminium and 60% more energy than Britain and the USSR put together).
...comes from HERE -
German coal and aluminium:
World economic survey - 1942-1944
...does it?

According to Page 73 Germany produced 325,000 tons of aluminium in 1943...while Britain produced 450,000 tons.

That's 325Kt of aluminium for Germany as opposed to 450Kt for the UK. You appear to have got BOTH figures WAY wrong.
Well, second to the copy of the world economic survey in google books, p. 73 we have:

Aluminium (1942)
US - 473,000 metric tons
Germany - 350,000
UK - 48,000

You confused the US with UK! :lol:

German production was overstimated in that survey, since they produced 265,000 tons in 1942 instead of 350,000. Maybe that number includes French production. Anyway, German aluminium figures here must have included production in occupied territories.
Let's have a look at coal. You said Germany produced 560 MT of coal..what you FAILED to note as that the figure the WES DOES have for 1943 is ONLY for TWO MONTHS and extrapolated upwards...while even THOSE come from a newspaper article in The Times by their diplomatic correspondent!
Well, then I use the 1942 figures:

page 204 War and Economy in the Third Reich

Production of coal: 513,400,000 tons
of with:
black (bituminous): 264,500,000
brown (lignite): 248,900,000

The USSR figures of 95 MT of coal in 1943 and 75 MT in 1942 used too the brown coal.
Last edited by Guaporense on 17 Dec 2009, 01:38, edited 1 time in total.
"In tactics, as in strategy, superiority in numbers is the most common element of victory." - Carl von Clausewitz

User avatar
Guaporense
Banned
Posts: 1866
Joined: 07 Oct 2009, 03:35
Location: USA

Re: German vs. Allied technology

#208

Post by Guaporense » 17 Dec 2009, 01:37

RichTO90 wrote:
phylo_roadking wrote:So in ONLY HALF OF 1944 - Great Britain produced over a quarter of what the U.S. did in the whole year. What a pity the WES doesn't have figures for the OTHER HALF of 1944 to ruin your comparison even more thoroughly :wink:
Major combatants 1944 was 171,000 ST, minor combatants was 88,200 ST, minecraft was 28,800 ST, minor craft was 24,500 ST, and landing craft was 270,900 ST so 754,400 ST total... (Fighting with Figures Table 7.3 and 7.4)
There you go Phylo! Britain made 171,000 tons of "major combatants" in 1944. Like I said before. Germany made about twice that.

As I said before:
Thats the numbers of Britain for YA:

Warships, thousands of tons

1941 - 226
1942 - 234
1943 - 174
1944 - 171

Germany made more tonnage of Submarines than UK made of all types of warships.

This 1.7 million tons is 90% made of cargo ships, to replace the losses inflicted by U-Boats.
Last edited by Guaporense on 17 Dec 2009, 01:40, edited 1 time in total.
"In tactics, as in strategy, superiority in numbers is the most common element of victory." - Carl von Clausewitz

User avatar
Qvist
Member
Posts: 7836
Joined: 11 Mar 2002, 17:59
Location: Europe

Re: German vs. Allied technology

#209

Post by Qvist » 17 Dec 2009, 01:38

Rich, Thanks for that invitation to squander my entire working day tomorrow. :)

As a general observation, I find that when I compile combat losses in the East from the reports of the armies, I invariably seem to end up with higher figures than shown in central documentation, whether its Org.Abt. overviews or VVW. Not by a huge margin though, typically perhaps 10% thereabouts.

cheers

User avatar
Guaporense
Banned
Posts: 1866
Joined: 07 Oct 2009, 03:35
Location: USA

Re: German vs. Allied technology

#210

Post by Guaporense » 17 Dec 2009, 02:21

LWD wrote: No I used GDP and armaments. The fact that they are differen than yours is irrelevant as both the ones I use and the ones you use are measures of varrying worth in measuring total economic stength.
Well, I can make the case that steel production is a very good statistic for determining economic resources for waging war in the first half of the 20th century. Since with steel you make bullets, cannons, tanks, ships, fortifications and weapons.
I wrote a longer response but the rest of your post is suspect for a number of reasons including:
1) Failure to include the whole British Comonwealth.
2) Failrue to take into account the artifically high value of the RM post 1932.
3) Cherry picking of dates. (IE looking at USSR GDP in 42)
1) Industrial production was only significant at Canada, India and Africa had rather small industrial production. So, increase Britain's number by 10-20% and I think you can get accurate stats.
2) I think that the RM was not artificially high in relation to the dollar and the ruble, because the prices of tanks and ships match when I use their exchange rates in 1939 and using price indexes to normalize everything to 1939 data.
3) Well, I made the argument that the economic resources available to Germany in 1942-43 were greater than the sum of Britain and the USSR.
Other areas where it is suspect are:
1) When and how the GDP of conqured territories should be added.
2) Relying on steel production alone or with only one or two other measures such as Aluminum production as a measure of economic or industiral strength.
4) Your numbers in general and how you interpret them.
1) GDP of annexed territories to the Reich should be added immediately. But I think that you should not measure GDP of occupied territories not annexed, instead you should compute their payment of occupation forces.
2) They are good measures: With Steel you make guns, bullets, cannons, horseshoes, ships and tanks. With Aluminium you make aircraft. With coal and oil you make energy to make an industrial economy work. Steel and coal were the most important indicators of raw industrial strength of potential munitions production in the first half of the 20th century.
4) Them we cannot have a rational discussion.
Last edited by Guaporense on 17 Dec 2009, 02:48, edited 1 time in total.
"In tactics, as in strategy, superiority in numbers is the most common element of victory." - Carl von Clausewitz

Post Reply

Return to “Economy”