Quantitative Comparison: Germany, Japan and the US

Discussions on the economic history of the nations taking part in WW2, from the recovery after the depression until the economy at war.
Post Reply
User avatar
Guaporense
Banned
Posts: 1866
Joined: 07 Oct 2009, 03:35
Location: USA

Quantitative Comparison: Germany, Japan and the US

#1

Post by Guaporense » 01 Aug 2012, 07:08

Germany and Japan

GNP/GDP MER billions of current dollars:

-------- Germany ---------- Japan ------- ratio
1935 --- 30.00 ------------- 5.278 ------- 5.684
1936 --- 33.30 ------------- NA ---------- NA
1937 --- 37.43 ------------- 6.583 ------ 5.686
1938 --- 46.18 ------------- 7.498 ------ 6.159
1939 --- 51.60 ------------- 8.112 ------ 6.361

Size of the labor force in 1939, thousands and nominal productivity:

Germany --- 40,630 --------- 1,269.90
Japan ------ 32,759 --------- 247,60

In 1939, the average price of a machine tool sold in Japan was 4,108 yen. Japan’s GDP was 31.23 billion yen. Which means it was equivalent to 7.6 million machine tools. While the average price of a machine tool sold in Germany was 3,485 Rm and Germany’s GNP was 129 billion Rm, which means it was equivalent to 37.02 million machine tools, a ratio of 4.87.

In terms of market exchange rates, in 1939 Japan’s GDP was 8.1 billion dollars, while Germany’s GNP was 51.6 billion dollars, a ratio of 6.37. But note that Germany’s machine tools were generally of superior quality, as Germany was the world’s leading exporter/producer of machine tools in the 1930’s. So the machine tool GDP underestimates Germany in relation to Japan.

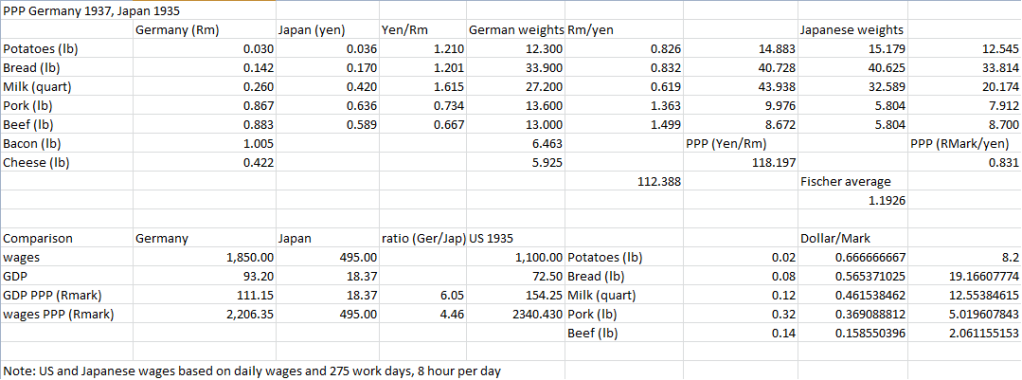
Using other products, in terms of food, in 1935 a pound of bread sold in Japan for 0.17 yen (11), while GDP was 18.37 billion yen. So GDP was equivalent to 108 billion pounds of bread. In Germany 1937, a pound of bread sold for 0.1415 Rm (10), while GNP was 93.2 billion Rm, equivalent to 659 billion pounds of bread. That’s 6.1 times larger than Japan’s GDP 2 years earlier and fits closely the MER ratio. If we use meat prices, a pound of pork sold for 0.867 Rm (10) in Germany, 1937, while it sold for 0.7 yen (11) in Japan 1935. Producing a closer GDP ratio of 4.1. While a quart of milk sold for 0.26 Rm (10) in Germany and 0.42 yen (11) in Japan, producing a GDP ratio of 8.2. The average of the three ratios is 6.13, fitting closely the 6.37 ratio obtained from exchange rates in 1939.

I have made a more detailed set of calculations here:
Image

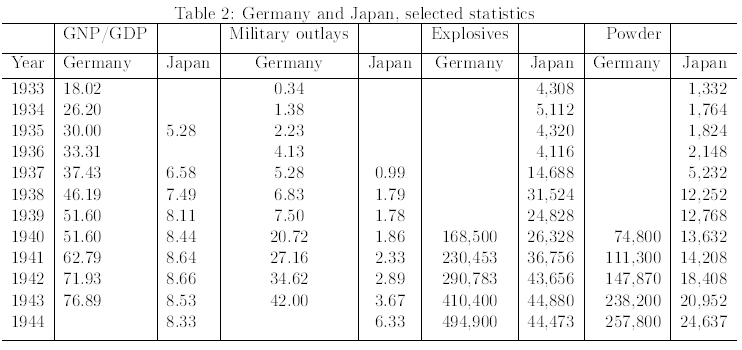
Germany’s economy was much larger and more powerful than Japan’s, also was more technologically advanced and so could produce more munitions in proportion to it’s GDP. In 1943, for instance, Germany produced 410,400 tons of explosives and 238,200 tons of powder, while Japan produced 44,880 tons of explosives and 20,952 tons of powder. (12) This huge discrepancy helps to explain the huge discrepancy in Allied casualties in fighting Germany and Japan as explosives and powder determine the total amount of energy released by the weapons systems of both countries and thus are indicators of available firepower to the armed forces.
"In tactics, as in strategy, superiority in numbers is the most common element of victory." - Carl von Clausewitz

South
Member
Posts: 3590
Joined: 06 Sep 2007, 10:01
Location: USA

Re: Quantitative Comparison: Germany, Japan and the US

#2

Post by South » 01 Aug 2012, 09:04

Good morning Guaporense,

Your provided more detailed set of calculations on chart has a note.

Please confirm that US workers had 8 hour days with 275 work days per year. I've heard otherwise from workers and also read material confirming my conversations.

The chart presents potatoes but not rice.

Re: "the huge discrepancy in Allied casualties in fighting Germany and Japan...";

Are you excluding allied USSR forces?


Warm regards,

Bob


User avatar
Guaporense
Banned
Posts: 1866
Joined: 07 Oct 2009, 03:35
Location: USA

Re: Quantitative Comparison: Germany, Japan and the US

#3

Post by Guaporense » 12 Aug 2012, 23:11

More data:

Image

On the methodology used:

GNP/GDP figures and military expenditure figures are converted to current dollars using market exchange rates from 1933 to 1939. While GNP and military expenditure figures from 1940 to 1944 are converted to 1939 marks or yens using the GNP deflator and later converted to 1939 dollars using the exchange rate, German figures are in terms of GNP while Japan's figures are GDP. German GNP for 1942, 1942 and 1943 include GNP of the occupied territories, estimated by extrapolating the proportion of French GNP paid in occupation taxes and converted to 1939 dollars at market exchange rates. The data on explosives and powder is measured on metric tons.

Sources

-- GDP/GNP figures: Harrison, the Economics of WW2, converted to dollars using: http://www.paper-dragon.com/1939/exchange.html
-- Explosives/Powder figures: http://archive.org/stream/effectsofstra ... explosives, http://www.sturmvogel.orbat.com/ussbsappd.html
"In tactics, as in strategy, superiority in numbers is the most common element of victory." - Carl von Clausewitz

User avatar
Guaporense
Banned
Posts: 1866
Joined: 07 Oct 2009, 03:35
Location: USA

Re: Quantitative Comparison: Germany, Japan and the US

#4

Post by Guaporense » 12 Aug 2012, 23:49

South wrote:Good morning Guaporense,

Your provided more detailed set of calculations on chart has a note.

Please confirm that US workers had 8 hour days with 275 work days per year. I've heard otherwise from workers and also read material confirming my conversations.
Well, in UK and Germany the work year was 2,200 hours and 2,187 hours, respectively, in 1937. Using 275 workdays and 8 hours per day yield 2,200 hours. But I am not sure if the US also had similar levels of work hours in the 1930's.
The chart presents potatoes but not rice.
I don't have the price of rice for Germany in 1937. I only used the prices that I found in both datasets of prices, which severely restricted my comparison to only 5 goods.

A larger number of goods would have allowed a more rigorous comparison of the relative price levels in Germany and Japan in relation to 1937 marks and 1935 yens. Currently, it appears that 1 Mark in 1937 Germany was equivalent to 1.19 yens in 1935 Japan.
Re: "the huge discrepancy in Allied casualties in fighting Germany and Japan...";

Are you excluding allied USSR forces?
I mean that when US forces fought German forces they suffered more casualties relative to fighting Japanese forces. For example, at the Battle of the Bulge, to inflict 67,000 casualties on the Germans the Allies lost 91,000 men. While in Okinawa, to inflict 105,000 permanent casualties on the Japanese forces (KIA & MIA) the US lost 51,000 men (KIA, MIA and WIA). This discrepancy is mostly the product of a much higher amount of firepower available to German divisions if compared to Japanese divisions.

If we compare, in 1944, Germany produced 650,000 tons of explosives and powder, compared to only 65,000 tons for Japan. In 1944, the German armed forces were twice the size of the Japanese armed forces in terms of manpower, but each soldier had several times the amount of firepower available. So, a typical German division had several times the firepower of a Japanese division. Explaining why the Germans inflicted so many casualties on the allies compared to the Japanese.
"In tactics, as in strategy, superiority in numbers is the most common element of victory." - Carl von Clausewitz

User avatar
LWD
Member
Posts: 8618
Joined: 21 Sep 2005, 22:46
Location: Michigan

Re: Quantitative Comparison: Germany, Japan and the US

#5

Post by LWD » 13 Aug 2012, 21:04

Exchange rates for converting dollars to Marks aren't very accurate. The Mark was over valued for most of the 30's for political reasons and it had a signifcant and negative impact on German industry.

Post Reply

Return to “Economy”