On estimating the warmaking potential of the world's regions

Discussions on the economic history of the nations taking part in WW2, from the recovery after the depression until the economy at war.
Post Reply
User avatar
Guaporense
Banned
Posts: 1866
Joined: 07 Oct 2009, 03:35
Location: USA

Re: On estimating the warmaking potential of the world's regions

#91

Post by Guaporense » 02 Apr 2017, 21:36

Guaporense wrote:Image
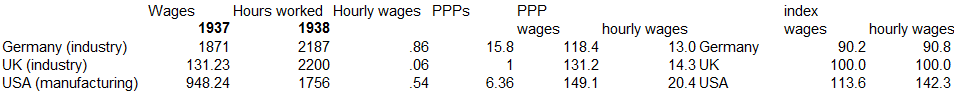
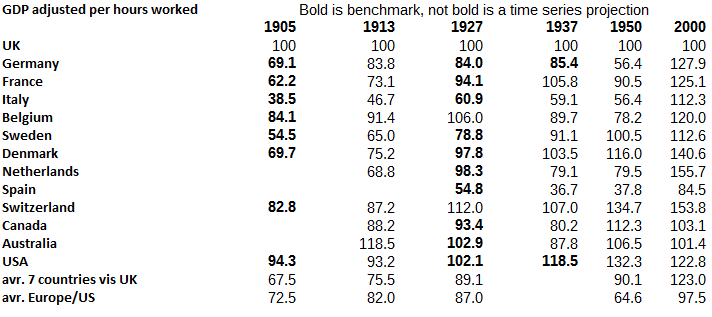
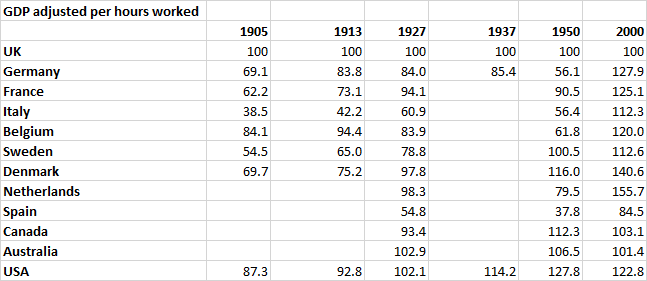
I adjusted the per capita incomes by the average amount of hours worked, the results are not substantially different for most cases but for US 1937 they show clearly the increase in US's labor productivity versus the UK even during the great depression. While for Germany vis UK they show a constant ratio of productivity from 1913 to 1937.

Image

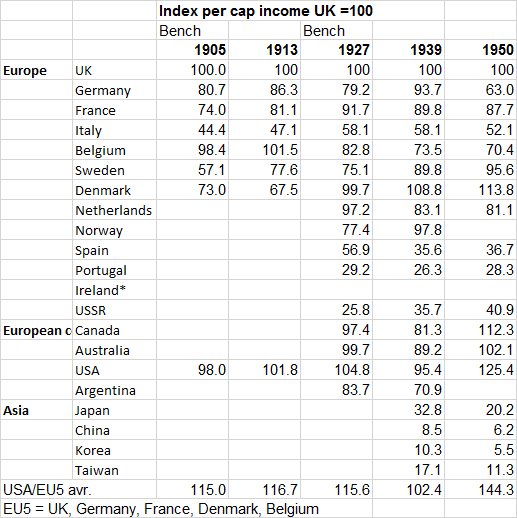
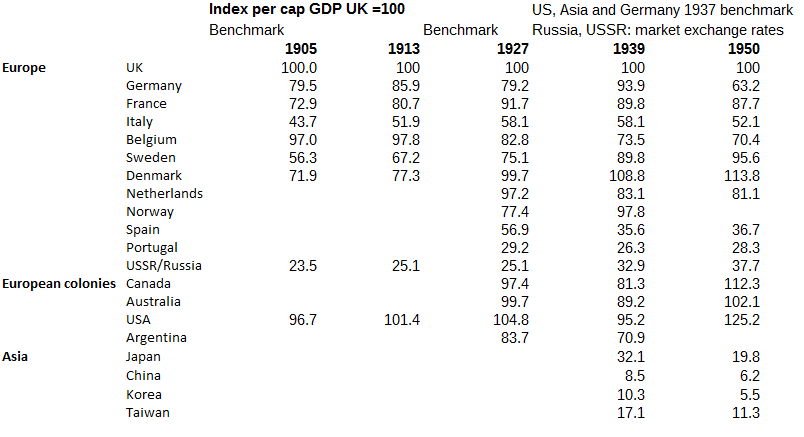
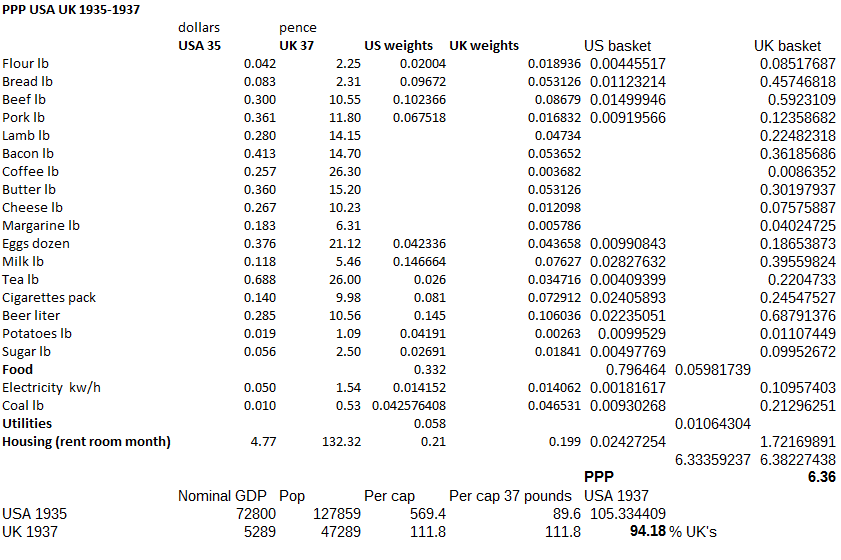
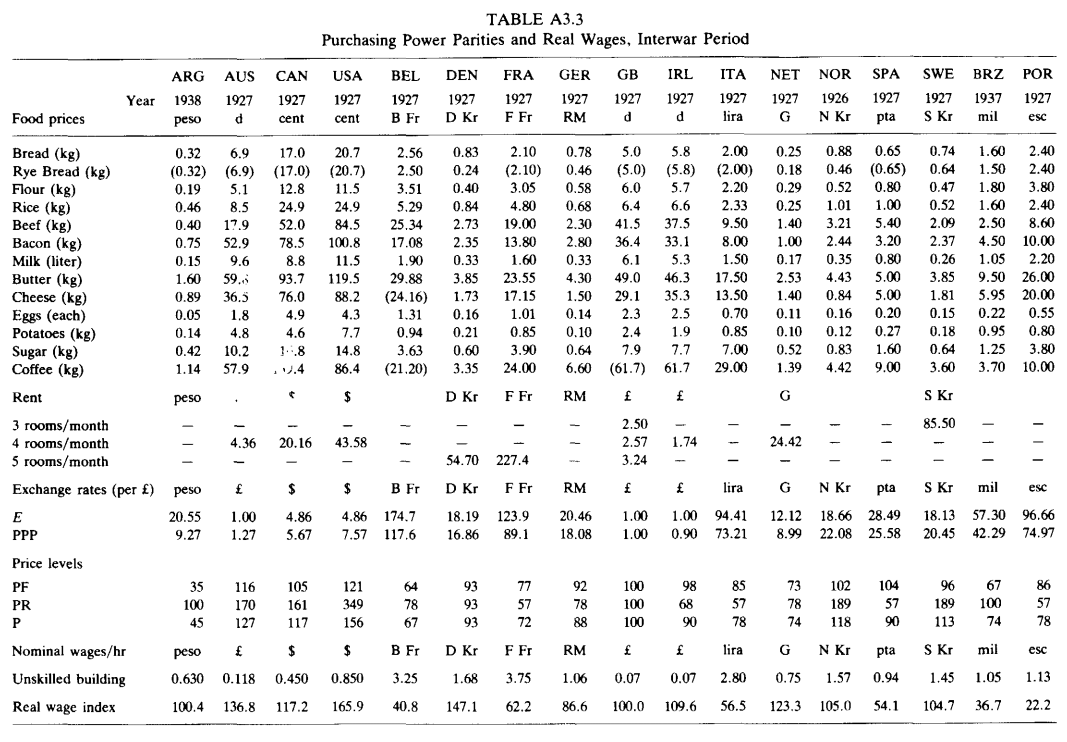
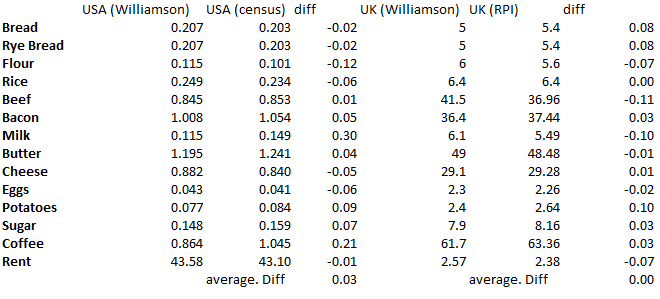
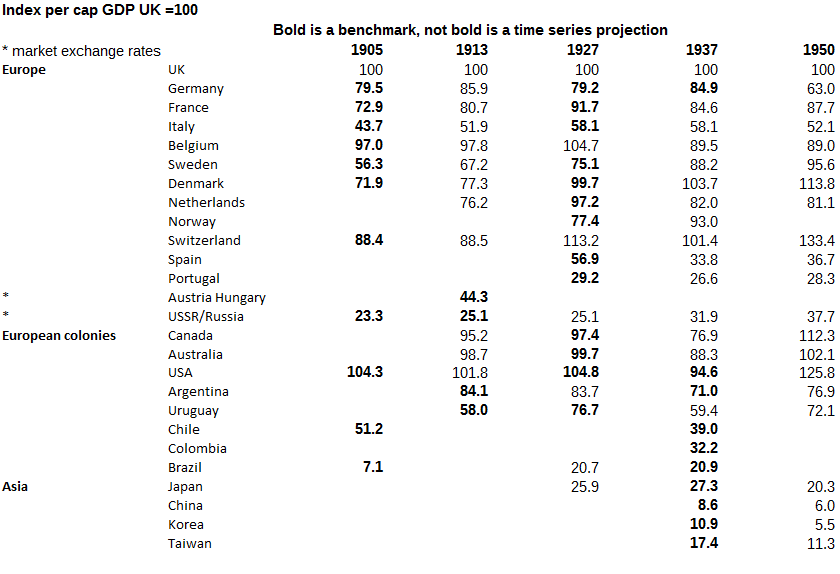
(using the Williamson's PPP benchmarks from 1905, 1927 and the 1937 estimates of PPPs for UK, US and Germany I did)

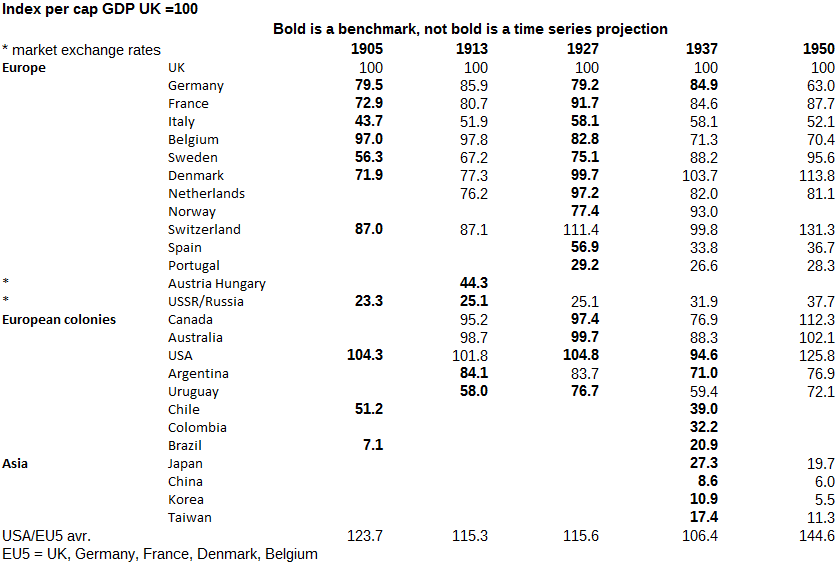
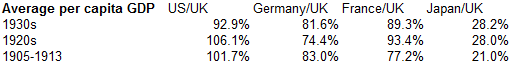
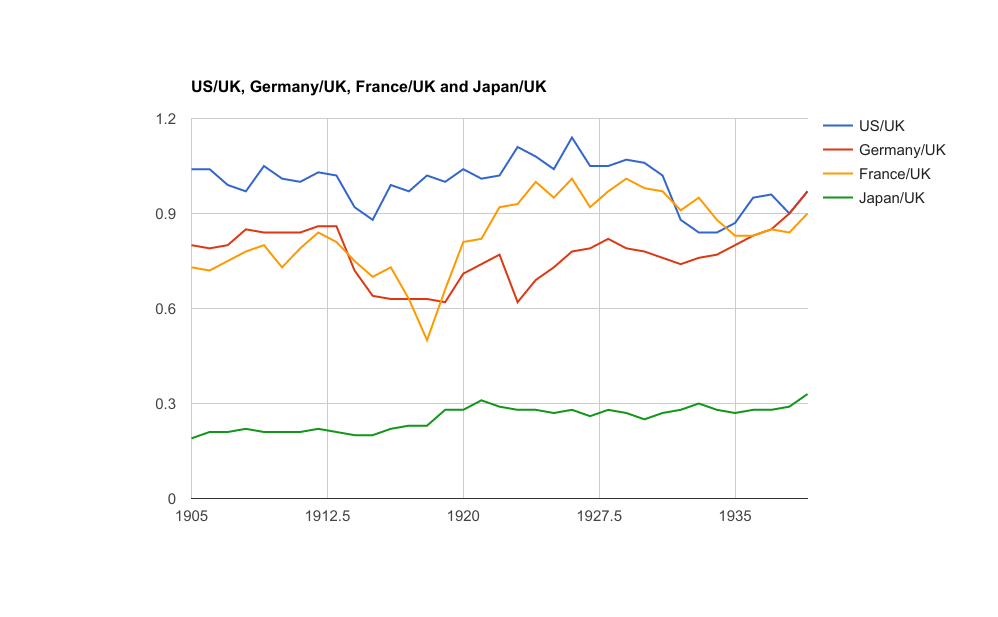
While GDP that was not-adjusted by the number of hours worked showed the US at a much smaller level relative to the UK and Germany in 1937-39 while if we adjusted by the number of hours worked it shows that US's productivity was increasing continuously relative to Germany and the UK since 1913. I also applied that methodology for the number of hours worked in 2000, it shows that UK lost it's productivity lead by a brutal degree over the 20th century: from the number 1 economy in the world to a productivity level below the average for developed countries. While the US and continental Europe converged in GDP adjusted by hours worked (in recent years the US's per capita income is higher than Europe's because they worked more hours: 1,878 hours in 2000 compared to 1,463 hours for Germany and 1,443 hours for France, productivity per hour is similar).

I also compared this methodology of estimating productivity with the GDP per hour worked figures from the OCDE:

Image

The correlation was very high between the two sets of figures (although the implied productivities of Belgium and the Netherlands didn't fit well with the data).
"In tactics, as in strategy, superiority in numbers is the most common element of victory." - Carl von Clausewitz

User avatar
Guaporense
Banned
Posts: 1866
Joined: 07 Oct 2009, 03:35
Location: USA

Re: On estimating the warmaking potential of the world's regions

#92

Post by Guaporense » 04 Apr 2017, 04:21

Measuring the importance of occupied territories for Germany's war effort in WW2 is difficult: mainly because the tax revenues from occupied territories were in grossly undervalued local currencies besides a lot of taxation done in kind (i.e. state confiscation of physical assets). Overall, though, one way to measure the contribution of occupied territories is to measure the difference in military expenditures from WW1 to WW2 relative to pre-war Net National Product. I used the nominal figures for military expenditures rather than trying to deflate them because in WW2 Germany froze a lot of prices and enforced rationing which means that real inflation rates were underestimated and also that their military expenditures would tend to be inflated relative to prices of civilian goods which were frozen below their equilibrium levels (hence, deflating the military expenditures in WW2 would lead to an overestimation of their size vis WW1 when prices were relatively less controlled).

So, in WW1 German military outlays up to 1918 were 251% of their pre-war net national product, in WW2, German military outlays up to the end of 1943 (hence about the same amount of time as WW1) were 382% of pre-war NNP. But, in WW1, Germany proper was 88% of the GDP inside the industrialized sphere under German military territorial control (Belgium was the rest) in WW2, Germany proper was 56% of GDP, with France, Belgium, Netherlands, Denmark and Norway being the industrialized countries under German occupation. The difference between military expenditures and this ratio suggests that occupied countries indirectly contributed a similar fraction of their net resources as Germany itself did in WW2.

Image
"In tactics, as in strategy, superiority in numbers is the most common element of victory." - Carl von Clausewitz


User avatar
Guaporense
Banned
Posts: 1866
Joined: 07 Oct 2009, 03:35
Location: USA

Re: On estimating the warmaking potential of the world's regions

#93

Post by Guaporense » 09 Apr 2017, 04:32

I gave a revision of my GDP figures for the pre-WW1 period (the UK's per capita income apparently was overestimated due to my use of Maddison's pop) and also I did a direct benchmark between Japan and the UK instead of using 2 layers of PPPs: a PPP of 1.5435 between yen and dollar and 7.57 between pound and dollar. Used the Maddison's GDP per cap. time series estimates to project the benckmarks of 1905, 1927 (and 1937 for US, Japan, UK, Germany, China, Korea and Taiwan).

Image

When comparing US and UK I noticed that I wasn't able to match well their expenditure weights to pairs of products so I used Williamson (1995)''s weights from the 1927 benchmark to get a benchmark, anyway, the difference between the two is 0.3% (in using Williamson (1995)''s weights from the 1927 benchmark, I managed to match 99% of the weights).

The benchmark of Japan/UK GDP per capita in 1937:

Image

The benchmark of US/UK GDP per capita in 1937:

Image
"In tactics, as in strategy, superiority in numbers is the most common element of victory." - Carl von Clausewitz

User avatar
Guaporense
Banned
Posts: 1866
Joined: 07 Oct 2009, 03:35
Location: USA

Re: On estimating the warmaking potential of the world's regions

#94

Post by Guaporense » 10 Apr 2017, 05:25

Per capita munitions production and per capita income

In WW1, per capita income had a severe influence on a country's capacity to produce munitions. In WW2, while it's harder to make comparisons between countries because of very distinct strategic situations (Germany produced 4 times as much ammunition as the UK but fewer combat aircraft).

This is an index of munitions production I made for WW1:
Image

This is a comparison between the per capita income estimates I made and per capita munitions production (I post it for the second time because I had to adjust a little bit the per capita figures in view of my correction of British population, I also have adjusted Italy's figure due to a change in time series (shifted to Maddison's time series to keep all countries' more consistent).

Image

Poor countries like Russia and to a smaller extent Austria-Hungary and perhaps Italy, couldn't produce as much in proportion to their GDP because they were less industrialized than rich countries like France, UK and Germany.

But in WW2, poor countries like Japan and USSR managed to produce more in proportion to their GDPs than rich countries like Germany and UK, although that doesn't take into account the quality of their equipment and the fact that in WW2 the strategic situation discrepancies between the great powers meant that their munitions output was very uncorrelated between different categories which made it harder to compare:

Image

For weighting I used monetary German output figures (industry sales for the Wehrmacht) for the 3rd quarter of 1943. Notice how Germany's lead in WW1 was greatly eroded by WW2, in proportion to GDP their output was the smallest in WW2. Although there is an important caveat here: the high Soviet output of equipment vis Germany reflected higher casualties and so higher needs for replacement, German output of artillery ammo for instance was much larger. US, UK and Japan were fighting a naval/aerial war which is more munitions intensive than Germany's-USSR war.
"In tactics, as in strategy, superiority in numbers is the most common element of victory." - Carl von Clausewitz

User avatar
Guaporense
Banned
Posts: 1866
Joined: 07 Oct 2009, 03:35
Location: USA

Re: On estimating the warmaking potential of the world's regions

#95

Post by Guaporense » 11 Apr 2017, 07:44

Guaporense wrote:These are the PPPs for 1927 and the raw prices used to compute them:

Image
To be sure about the accuracy of these purchasing power parities I did some research on average prices over many cities reported by the US census and other publications as well as the prices reported in the British RPI and compared then to the prices above that Williamson reported for goods in a set of cities (London in the UK, Philadelphia in the US) these are the results:

Image

Overall the prices of these two specific cities appear to match closely the country's average prices (US data for instance is for 53 cities, UK's data is for the whole country as well), with aggregate deviations of 3% and 0% for the US and UK respectively.

I redid his PPP using the same weights for US and UK, I got an even stronger pound: 7.86 to the dollar (given US prices are 3% higher on average while the differences of UK's prices cancel each other). That would imply in a US's per capita income 100.9% of the UK's instead of 104.8%.

The official exchange rate was extremely overvalued for the US. The League of Nations' estimates of manufacturing output for 1928 are based on official exchange rates which is why the US's manufacturing output was valued at 4 times the UK and 3.5 times Germany that year. Using these PPPs yield more reasonable figures. I guess the idea of US's economic superiority over the rest of the world during that period (which is not true, given many European countries had similar levels of per capita income: UK, Canada, Australia, Denmark, Netherlands and by the late 1930's, Norway and Sweden, Switzerland had higher levels of per capita income although my source is their official exchange rate against the pound which might have been overvalued.

Although it's true real hourly wages in the US were substantially higher than in Europe even if their per capita income wasn't much higher:

Image
"In tactics, as in strategy, superiority in numbers is the most common element of victory." - Carl von Clausewitz

Richard Anderson
Member
Posts: 6399
Joined: 01 Jan 2016, 22:21
Location: Bremerton, Washington

Re: On estimating the warmaking potential of the world's regions

#96

Post by Richard Anderson » 11 Apr 2017, 20:52

Guaporense wrote:But in WW2, poor countries like Japan and USSR managed to produce more in proportion to their GDPs than rich countries like Germany and UK, although that doesn't take into account the quality of their equipment and the fact that in WW2 the strategic situation discrepancies between the great powers meant that their munitions output was very uncorrelated between different categories which made it harder to compare:

Image
No, what makes it "harder to compare" is the complete lack of transparency in the figures you continue to flog about. Where are they from? What do they include? Are they in hundreds? Thousands? Millions? Tons? Tonnes? Hundredweight? :roll:

US:
Is that "3" "guns" in 1941? Or 300? Or 3,000? In fact, in 1941 the US built 63 new heavy artillery pieces, rebuilt to modern standards 1,445 more, built 4,050 light field and antitank guns, built 6,295 tank guns and howitzers, 171 antiaircraft guns, and 469 naval guns.

Is that 9/10ths of a tank? Or 900 tanks? In fact, in 1941 the US built 2,601 light tanks, 1,420 medium tanks, and 1 heavy tank.

Is that 1.4 combat aircraft? Or 1,400? Or 14,000? In fact, in 1941 the US built 9,258 combat aircraft.

Major naval vessels? In 1941 the US built 33. What is "544"?

Artillery ammunition? In 1941, the US built 844,000 rounds of ammunition for heavy field artillery, 1,896,000 rounds of light field, tanks, and antitank artillery, and about 583,000 rounds of naval artillery ammunition.

Germany:
Is that "22" "guns" or 22,000? In 1941, they built 2,136 field artillery pieces, 2,388 flak guns, 732 KwK and PaK, 1,608 infantry guns, and 300 naval guns.

Aircraft...8,448! Amazing, we have a correlation between data sets.

And all those numbers have their own issues built into them.

What continues to astonish me though, is not that your numbers are so amorphous, faulty, or simply untrue, since I believe that is simply a given now. No, it is that so many think that when I am correcting those figures it is because I am being a jingoistic American trying to somehow prove 'Murica done one the war and we done need no stinkin' furriners to help us...when it is actually the falsified data I am pointing out.
Richard C. Anderson Jr.

American Thunder: U.S. Army Tank Design, Development, and Doctrine in World War II
Cracking Hitler's Atlantic Wall
Hitler's Last Gamble
Artillery Hell

User avatar
Guaporense
Banned
Posts: 1866
Joined: 07 Oct 2009, 03:35
Location: USA

Re: On estimating the warmaking potential of the world's regions

#97

Post by Guaporense » 12 Apr 2017, 08:37

Found an estimate of benchmark PPPs and per capita income levels for several Latin American countries! :D

http://www.bvrie.gub.uy/local/File/JAE/ ... 541112.pdf

Plan to update my GDP per cap table using this info.
"In tactics, as in strategy, superiority in numbers is the most common element of victory." - Carl von Clausewitz

Richard Anderson
Member
Posts: 6399
Joined: 01 Jan 2016, 22:21
Location: Bremerton, Washington

Re: On estimating the warmaking potential of the world's regions

#98

Post by Richard Anderson » 12 Apr 2017, 17:21

Guaporense wrote:Plan to update my GDP per cap table using this info.
Yes, you must be an economist since your motto apparently is "ignore all data issues and forge on for the Fuehrer!" :roll:
Richard C. Anderson Jr.

American Thunder: U.S. Army Tank Design, Development, and Doctrine in World War II
Cracking Hitler's Atlantic Wall
Hitler's Last Gamble
Artillery Hell

User avatar
Guaporense
Banned
Posts: 1866
Joined: 07 Oct 2009, 03:35
Location: USA

Re: On estimating the warmaking potential of the world's regions

#99

Post by Guaporense » 13 Apr 2017, 02:51

@R.A. these figures come from here: https://www.amazon.com/Economics-World- ... 0521785030, chapter 1, they explain what they mean in there.

Final GDP figures

(did some last-minute revisions of pre-1914 US GDP using Balke, Gordon (1989)'s time series)

So, the final version of the GDP per cap. tables and adjusted per hour worked (I did some revisions on the PPPs I computed for 1937 as well for Japan and the US, I re-weighted the food, rent and utilities shares to reflect the shares used in the original papers I took those expenditure shares from). For Argentina and Brazil I used Williamson's PPPs instead of those in that paper, they appear to be of low quality but I had to use it for Chile, Colombia and Uruguay. I also found a PPP benchmark for 1905 for Switzerland: 23.07 francs per 1 UK pound, which allowed me to compute GDPs in PPP for Switzerland, they match Maddison's figure very closely though.

Image

Image

I differentiate between benchmarks (where the PPPs are computed for that year and nominal GDP is converted) from time series projections (where the GDP figures are computed for 1905 and them projected to future or past dates using per capita growth rates (such as 50% for Germany from 1905 to 1937 and 37% for the UK over the same period).
Last edited by Guaporense on 13 Apr 2017, 06:10, edited 2 times in total.
"In tactics, as in strategy, superiority in numbers is the most common element of victory." - Carl von Clausewitz

User avatar
Guaporense
Banned
Posts: 1866
Joined: 07 Oct 2009, 03:35
Location: USA

Re: On estimating the warmaking potential of the world's regions

#100

Post by Guaporense » 13 Apr 2017, 05:38

On the differences between benchmark estimates and time series projections:

Maddison's figures are based on the 1990 round of the international price comparison program and his PPPs are in terms of 1990 dollars. He used estimates of long run economic growth to derive past figures of GDP: like, Germany's per cap income from 1910 to 1990 is estimated to have grown 300%, it was 18,000 dollars in 1990 so it's 4,500 dollars in 1910. Etc. Instead, if we use direct GDP per capita conversions based on the specific year: 1927, for instance, we can get quite different figures from using time series projected backwards 63 years, although the average discrepancy between my figures and Maddison's has been about 8%, so not too much to make Maddison's figures completely disconnected from historical reality. Still, using time series projections over direct PPPs can yield substantially distinct outcomes: Japan's pre-war GDP has been revised downwards by about 25% from Maddison's estimate (from 36% to 27% of UK's income, for instance).

See appendix 7 of http://eprints.lse.ac.uk/67032/1/WP245.pdf, for some discussion regarding the use of time series projections.

These are some discrepancies I found:

US/UK GDP per cap 1937, implied from 3 benchmarks:

1937 benchmark - 94.6
1927 benchmark - 88.5
1905 benchmark - 97.7

Germany/US GDP per cap in 1937, implied from 3 benchmark demonstrated lower variability:

1937 benchmark - 94.2
1927 benchmark - 91.0
1905 benchmark - 89.3

Overall, though it's true that we can arrive at some conclusions: we know German per capita income around 1937 was about 90% of the US's and UK's per capita income was slightly higher than the US in the same year, perhaps by about 5%, but not more than about 10%.
Last edited by Guaporense on 13 Apr 2017, 06:30, edited 1 time in total.
"In tactics, as in strategy, superiority in numbers is the most common element of victory." - Carl von Clausewitz

User avatar
Guaporense
Banned
Posts: 1866
Joined: 07 Oct 2009, 03:35
Location: USA

Re: On estimating the warmaking potential of the world's regions

#101

Post by Guaporense » 13 Apr 2017, 06:26

And the GDPs of the seven great powers (plus Austria-Hungary back in the day) relative to the US were from 1913 to 1937:

Image

Notice how Germany declined in relative terms from 1913 to 1937, relative to the US, Russia, Italy, France, Japan etc. Mainly because of it's loss in WW1, Germany lost a lot of territory and it's population grow was also reduced. In per capita terms Germany was also weaker in 1937 relative to 1913:

Germany's per capita GDP relative to the average of UK, France, Italy, Sweden, Denmark and Russia:

1913 - 1.23
1927 - 0.99
1937 - 1.05

In 1913 Germany was the fourth richest country in Europe in per capita terms, after UK, Belgium and Switzerland. By 1927, it fell behind France, Denmark, Netherlands, being in 7th place, by 1937, Norway and Sweden had passed Germany as well. Overall, it's true Germany was relatively substantially weaker from an economic sense in 1937 compared to 1913.
"In tactics, as in strategy, superiority in numbers is the most common element of victory." - Carl von Clausewitz

User avatar
Guaporense
Banned
Posts: 1866
Joined: 07 Oct 2009, 03:35
Location: USA

Re: On estimating the warmaking potential of the world's regions

#102

Post by Guaporense » 14 Apr 2017, 03:12

I adjusted Switzerland's GDP figure (the estimate was made against the average 1900's GDPs, at 88.4% of UK's per capita income), while I decided to go for Belgium's 1905 benchmark all the way: the quality of the Williamson's PPPs for 1905 is higher than the 1927's PPP because it's done by a survey of many cities and towns (the UK's Board of Trade who did surveys of prices similar to surveys' done recently). And also, Belgium's nominal GDP data for the 1920's is very volatile: it was increasing at 15% per year, so high levels of inflation and volatility meant that the benchmark PPP might not apply to the nominal GDP figure so that year, which helps to explain why it doesn't fit at all with the time series projection from 1905. So I decided to drop that benchmark and use the 1905 benchmark all the way (so the 1950's figure obviously wouldn't be very accurate like Maddison's figures):

Image

Image
"In tactics, as in strategy, superiority in numbers is the most common element of victory." - Carl von Clausewitz

User avatar
Guaporense
Banned
Posts: 1866
Joined: 07 Oct 2009, 03:35
Location: USA

Re: On estimating the warmaking potential of the world's regions

#103

Post by Guaporense » 14 Apr 2017, 07:21

I also did an comparison of GDP aggregate adjusted by hours worked: perhaps a better measure of aggregate economic resources than GDP because it adjusts and hence includes the time spend on leisure as well:

Total GDP adjusted per hours worked --- 1913-- --- 1927 ------- 1937
US-------------------------------------------- 100.0 ------ 100.0 ---- 100.0
Germany ------------------------------------ 61.7 ------- 44.1 ------- 39.6
UK ------------------------------------------- 50.2 -------- 37.2 ------ 30.9
France --------------------------------------- 31.9 ------- 31.6 ------- 29.0
Italy ------------------------------------------ 18.2 ------- 19.9 ------ 16.6

Clearly shows a continuous decline of Germany and the UK relative to the US (and also, apparently, to France): in 1913, Germany's population was 70% of the US's, by 1937, it was 52% while relative productivity per hour worked decreased substantially, by a factor of about 20-25%. In terms of economic odds, Germany was at their strongest in 1913: Germany+Austria-Hungary was equivalent to 80% of the US's GDP, in 1937, Germany+Austria+Hungary was equivalent to about 52% of the US's GDP. So while the Axis block controlled greater relative resources compared to the central powers in 1913, the great powers themselves were weaker: Germany was significantly weaker, while Italy and Japan were not as remotely as helpful as Austria-Hungary was: Austria-Hungary produced 82 million shells in WW1, mobilized 9 million soldiers and lost millions of soldiers in battle at the main fronts in the war.
"In tactics, as in strategy, superiority in numbers is the most common element of victory." - Carl von Clausewitz

User avatar
Guaporense
Banned
Posts: 1866
Joined: 07 Oct 2009, 03:35
Location: USA

Re: On estimating the warmaking potential of the world's regions

#104

Post by Guaporense » 15 Apr 2017, 07:29

One interesting exercise is to compare the variance of my GDP per capita figures with Maddison among a set of industrialized economies in the 1927 year:

France, Germany, Netherlands, Belgium, UK, US, Canada, Australia, Sweden, Norway, Denmark and Switzerland.

Maddison's variance: 359.3
My estimates variance: 136.6

The variance and the distance between the lowest and highest values are much lower in my estimates. The reason is that in 1927 after decades of convergence, the world's industrialized countries were converging to similar income levels: Belgium, Switzerland, Netherlands, Denmark, US, UK and France were very close in per capita income in 1927. The reason is that the technological frontier sets the limit of how high economic output per capita can be and the most developed countries tend to cluster around that frontier. Today, for example, according to a 2005 benchmark estimate of GDP per hour worked, Germany, UK, Sweden, Netherlands, France, Denmark, Canada, Finland and Belgium are all about 10% from the US, which means these countries are at the technological frontier.

Maddison's figures don't fit into that framework perhaps because the statistical noise of projecting back a set of benchmarks from the 1990's into the 1920's causes massive drifts. Anyway, it appears that around the late 1920's, just before the Great Depression, the world's industrialized economies were all close together in terms of productivity, after 1930 and with WW2, they diverged apart.

Germany was one of the poorest industrialized countries in 1927: they were converging to the UK's level of per capita income from the late 19th century up to WW1, but then WW1 and hyperinflation set Germany back about 20 years relative to the UK: so in 1927 their relative per capita income was about the same as in 1905, while France, Sweden, Netherlands, Switzerland, were all growing faster than the UK. This sequence of major macroeconomic disasters prevented Germany from reaching the same level of living standards as other developed countries and the Great Depression hit Germany harder than other European economies, as a result, they voted the Nazi Party into power in the early 1930's.

These were average per capita GDPs by decade, using the PPPs benchmarks for each period when avaiable and time series projections when not (exp. US I used Williamson's PPP benchmark for 1905-1913, then his 1927 PPP for 1919-1929 and my PPP for 1930-1939:

Image

And a graph from 1905 to 1939:

Image

I did a spreadsheet on google.docs on the relative series of per cap GDP vis the UK:

https://docs.google.com/spreadsheets/d/ ... sp=sharing
"In tactics, as in strategy, superiority in numbers is the most common element of victory." - Carl von Clausewitz

User avatar
Guaporense
Banned
Posts: 1866
Joined: 07 Oct 2009, 03:35
Location: USA

Re: On estimating the warmaking potential of the world's regions

#105

Post by Guaporense » 15 Apr 2017, 23:42

And here is the decreasing variance in per capita income among "developed countries" from 1905 to 1939:

https://docs.google.com/spreadsheets/d/ ... nteractive

Note how on average the industrialized countries converged to the UK in per capita income: from about 80% in the 1900's to about 92% in the late 1930's.
"In tactics, as in strategy, superiority in numbers is the most common element of victory." - Carl von Clausewitz

Post Reply

Return to “Economy”